")
Statistically based DOE provides several advantages over more simplistic approaches such “one-factor-at-a-time” experimentation. These advantages include:
- The use of statistical methodology to determine which factors are actually (statistically) significant
- Balanced experimental designs to allow stronger conclusions with respect to cause and effect relationships (as opposed to just finding correlations)
- The ability to understand and estimate interactions between factors
- The development of predictive models that are used to find optimal solutions for one or more responses
The last blog explored the first two advantages in detail. The second two advantages are discussed in this blog post.
To solve complex problems, an understanding of factor interactions is critical. If interactions did not exist, most problems would be relatively easy solve. So, what are interactions? We say that factors interact with each other when the effect that one factor has on the response depends on where another factor is set. Some examples include:
- The effect of curing time on bond strength depends on the temperature level
- The effect of a driver with the best technology on overall golf score depends on the length of the course
- The effect of medication dosage on blood pressure depends on the size and weight of the person taking it
The following story illustrates the importance of understanding factor interactions. Suppose I am a plant manager, and due to some customer complaints, I ask one of my process engineers to go out and perform a simple study of the impact that machine speed has on a critical characteristics (a radius). The engineer performs the study and summarizes the results in the graph below:
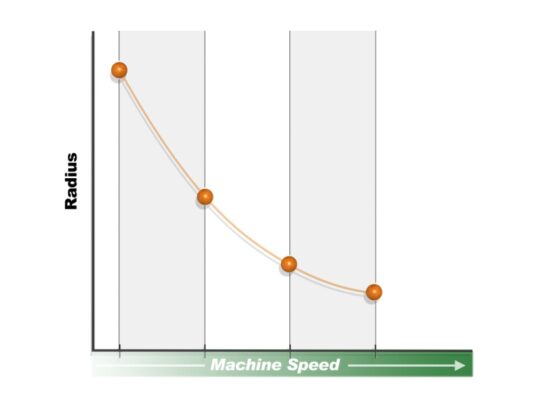
Thus, it appeared that increasing machine speed causes a decrease in the radius. I tried to use this information to solve our problem of controlling the radius, but not much improvement was seen. So then, I asked a different process engineer to repeat the study (using the same range of machine speeds). This time the results looked as follows:
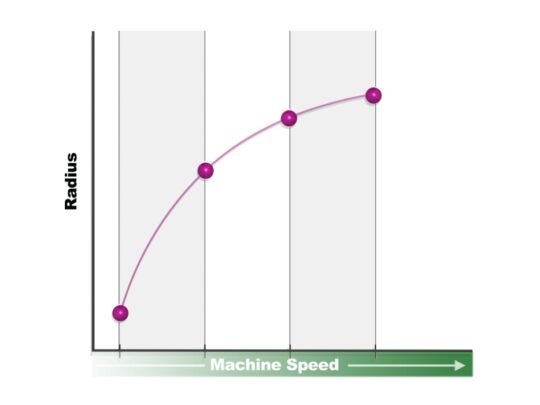
So, we observed a completely different result! Now the radius increases with machine speed. What is going on?
After some investigation of the two different trials, we discovered that they were conducted under different conditions. Specifically, the first engineer ran the machine at a pressure of 120 psi and the second engineer ran the machine at a pressure of 80 psi. Putting the results together we have:
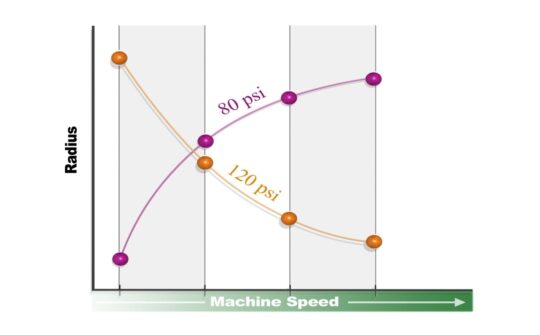
Now we can see that effect of Machine Speed on the Radius depends on the pressure! Machine Speed and Pressure are involved in a 2-factor interaction. By the way, this plot is called an “Interaction Plot” and is used to describe significant interaction effects.
Interactions are present everywhere and both a qualitative and quantitative understanding of their impacts on important outcomes (responses) must be developed. Our predictive models must include terms that account for interactions between factors to accurately model responses as a function of significant predictors. Many times, a factor will have an overall (main) effect on the response, but also be involved in an interaction with another factor. When applied correctly, DOE is extremely effective at uncovering both the main effects and interaction effects that impact the responses.
For some processes (like chemical reactions) factors can be involved in a 3-way interaction. That is, the nature of a 2-factor interaction can depend on yet a 3rd factor (like a catalyst). Note that in simple approaches (like one factor at a time experimentation) it’s impossible to understand and model factor interactions.
The final advantage of structured DOE is that we can develop predictive (mathematical) models that relate the factors and interactions to one or more responses. This is very powerful especially when we are trying to jointly optimize multiple (often conflicting) responses. Note that not all types of “DOEs” permit the development of predictive models. For example, Taguchi experiments may be useful for finding setups that minimize the impact of noise factors that are uncontrollable, but the outputs are not conductive to the development of a predictive model that can be optimized.
An example of a predictive model that predicts distortion of a glass window is:
Estimated Distortion = 0.3725 + 0.09 GlassTemp – 0.04771 PackTime + 0.13271 MoldTemp + 0.09896 (GlassTemp)(MoldTemp) – 0.07083 (PackTime)(MoldTemp) – 0.04021 (GlueThick)(PackTime)
The model is an equation that predicts a response as a function of one ore more factors and interactions effects. In the model above, GlassTemp has a significant main effect but also interacts with MoldTemp. The coefficients in front of the main factors behave like a slope in a liner model as they indicate the degree of the effect that the factor has on the response. The coefficients in front on the interaction terms (cross products) are a bit more difficult to interpret, so it’s easier to use an interaction plot. Below is an interaction plot for the Glass Temp*Mold Temp interaction.
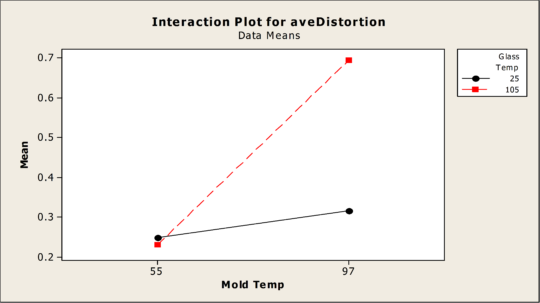
Here we can see how the effect of Mold Temperature on Distortion is highly dependent on the Glass Temperature. For colder glass (25 degrees), the effect of Mold Temperature increasing is slight, but for hotter glass (105 degrees), increasing the Mold temperature has a relatively big impact on Distortion.
In the last blog and this one, we have discussed why statistically based DOE provides several advantages over more simplistic approaches such “one-factor-at-a-time” experimentation.