")
We are ready to learn how to analyze the data collected during the experiment. This is the most exciting part of DOE! We will cover the analysis in this blog as well as the next several blogs.
The following are the main steps to perform during the analysis:
- Calculate the Main Effects and Interaction Effects
- Test the Effects for Statistical Significance
- Interpret the Significant Effects (Often with Plots)
- Develop Predictive Model(s)
- Perform Model Validation (Residual Analysis)
- Find Solutions and Perform Optimization to find Best Solution(s)
- Validate the Solutions
- Determine if Follow-up Experimentation is Necessary
First, we discuss the calculation of Main and Interaction Effects. In an earlier blog, we introduced Main Effects. For 2-level designs, they are calculated as follows:
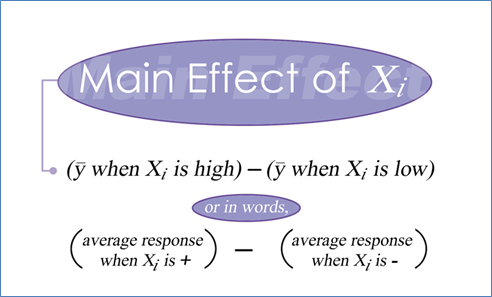
That is, for each factor, the main effect is calculated by finding the difference of the average responses when the factor is set “high” and “low”.
An example is shown below
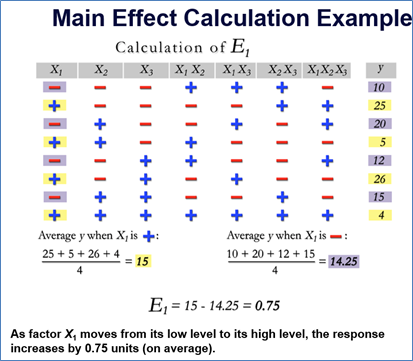
So, for factor, X1, the main effect (E1) is found by averaging the responses where X1 is high and averaging the responses when X1 is low. The result is the above example is 0.75, which means that as X1 goes from its low level to its high level, the response increases by 0.75 units, on average. Note that just because the effect is not zero, it is not necessarily statistically significant. Recall that experimental error exists, and only effects that are clearly bigger than the expected error are actually significant. We will address testing for statistical significance in next week’s blog.
As another example, we illustrate the calculation of E2 (Main Effect for Factor X2)
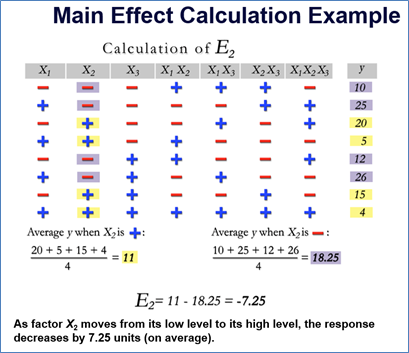
Here, the effect is negative which means that the response decreases as the factor increases from low to high.
We can construct Main Effect Plots by plotting the two average response values and connecting them with a straight line. They are shown below for E1 and E2.
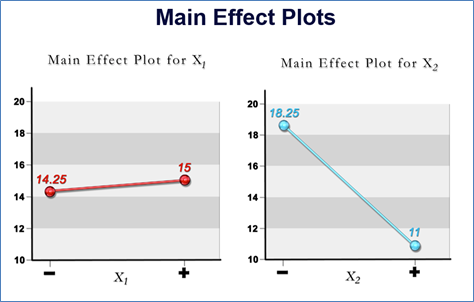
Clearly E2 is larger in magnitude than E1 but before we’d use these effects in a model, they must be tested for statistical significance.
Now, let’s talk about calculating 2-factor interaction effects. The first one is E12 which is the effect associated with the X1X2 interaction. We simply use the X1X2 interaction column. This is just the product of the X1 and X2 columns where “-“ is a -1 and a “+” is a +1. When X1 and X2 are both -1 or both +1, then the interaction is +1. Otherwise when one is +1 and the other is -1, then the interaction is -1. As before we find the average response when the interaction is “high” and the average response when the interaction is “low”. The difference is the magnitude of the interaction effect.

How do we try to interpret interaction effects? Calculating interaction effects is easy but interpretation is more challenging. In the previous example, what does it mean for the X1X2 interaction to be equal to -13.75? We use a 2-factor interaction plot for interpretation. The 2-factor interaction plot is essentially a pair of main effect plots on the same graph.
First, we consider only the rows where X2 is high and we compute the main effect of X1 for those rows only. This main effect for those rows only is plotted. Then we do the same when X2 is low.

Shown, together on the same plot, we have:
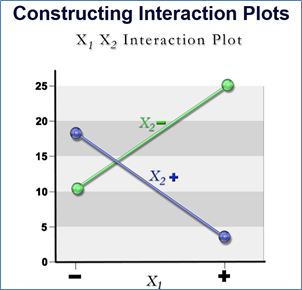
This plot lets us see how the effect of X1 on the response depends on X2. A significant interaction effects occurs when the effect of one factor on the response is very different depending on the level of another factor. When factors do not interact in a significant way the lines will be close to parallel.
It’s a good idea to try and interpret these plots (for the significant interactions) to see if they make sense from a physical or engineering perspective.
The Main and Interaction Effect plots are a very useful way to help communicate the results of the experiment. As we will see in an upcoming blog, the effects are simply used to calculate the coefficients in our mathematical model.